Debugging a webWPA android app in android terminal is not easy. Even if you have JSON.stringify() for every log in your web app you still see text based logs which are still hards to look at. Chrome developer tools comes handy at such time. To debug a webWPA android app using chrome developer tools, we need few things:
- 1). Android studio with WebWpa app project running
- 2). Chrome
- 3). Android device
- 4). Usb cable for usb debugging
Run android project on external device.
Very first thing you need is android project with WebWpa running. You can check this article for simple POC of the same. Now connect your external device and run your project on it. Make sure you have usb debugging enabled otherwise your device won’t be visible in external device list. Once app is running on android device, we are ready for next thing.
Initiate remote debugging in chrome.
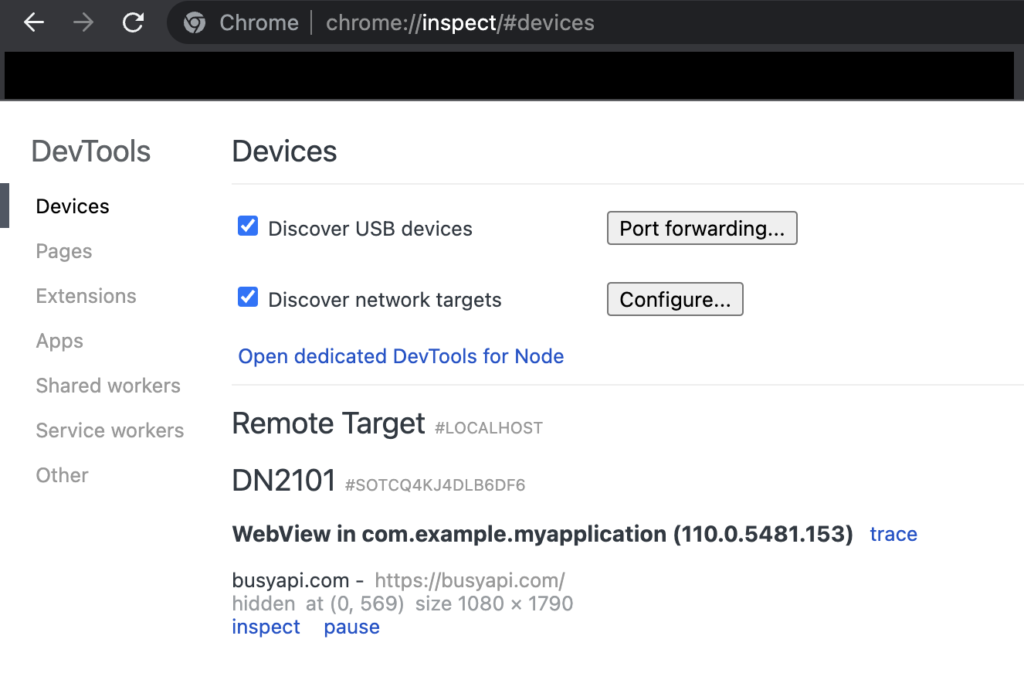
Open chrome on your pc, go to chrome://inspect/#devices. Connected devices (Your android phone) will be visible under Remote target tab.
Add necessary configuration in android project.
This is an important step, In android project, where WebWpa is initialised, following configs needs to be added
WebView.setWebContentsDebuggingEnabled(true);
Without this, WebWpa url won’t be visible in chrome tools.
Restart android project:
Keep chrome open and restart android project. Once it is up, WebWpa url (In my case its, https://www.busyapi.com) will be available to inspect in chrome tools like below:

Thats it, click on inspect and you can see all the web app logs in chrome without JSON.stringift();
Thanks for reading..
Pingback: connect android device with android studio - busyapi.com